|
|
|
Sources: European Commission - DG Agriculture
and Rural Development (Units I.1/L.1) and DG Economic and Financial Affairs
(AMECO database)/Eurostat
|
|
Updated: 18.10.2010
|
|
|
|
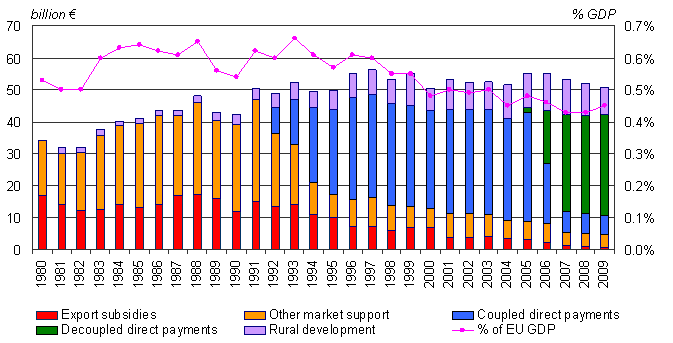
Annual expenditure, in 2007
constant prices.
|
|
|
|
This graph shows how the CAP
has evolved through the evolution of the CAP expenditure.
|
|
•In the 80s the expenditure was mainly due to price support through
market mechanisms (intervention and export subsidies).
|
|
•In the end of the 80s this expenditure in market mechanisms boosts due
to the agricultural surpluses.
|
|
•In 1992 there is the first big shift, due to the Mac Sharry reform.
The market mechanisms (in red and yellow) are reduced and replaced by direct
payments (in blue). These payments were paid per hectare or per animal. Thus
price support is replaced by producer support. Finally, spending on rural
development measures also increased (in purple).
|
|
•In 2003, one can see the impacts of the 2003 reform, with direct
payments shifting to decoupled payments (green). Payments are no longer paid
per ha or per animal but paid in function of what the farmer received in a
reference period. Spending in rural development also increases.
|
|
•Spending as been stabilized and despite the successive enlargements,
the overall spending as a share of the GDP has actually decreased in nominal
terms: 0.5% of GDP in the 80s to 0.4% now (graphic line).
|
|
|
|
•Stable expenditure level since mid-1990s despite enlargements
|
|
•Significant shift from market expenditure to direct payments and
increased expenditure for rural development
|
|
•Decreasing share of CAP in GDP. However, slightly increasing in 2009
due to economic crisis (-5% in GDP of EU-27)
|


